
Read Time – 2 minutes
Our brains were never designed to find stories in tables.
The numbers are all there. The targets are all there. Every row is accurate.
But the story stays hidden.
Because a table asks the reader to hunt, and executives don't hunt. They glance.
The 3-Second Test
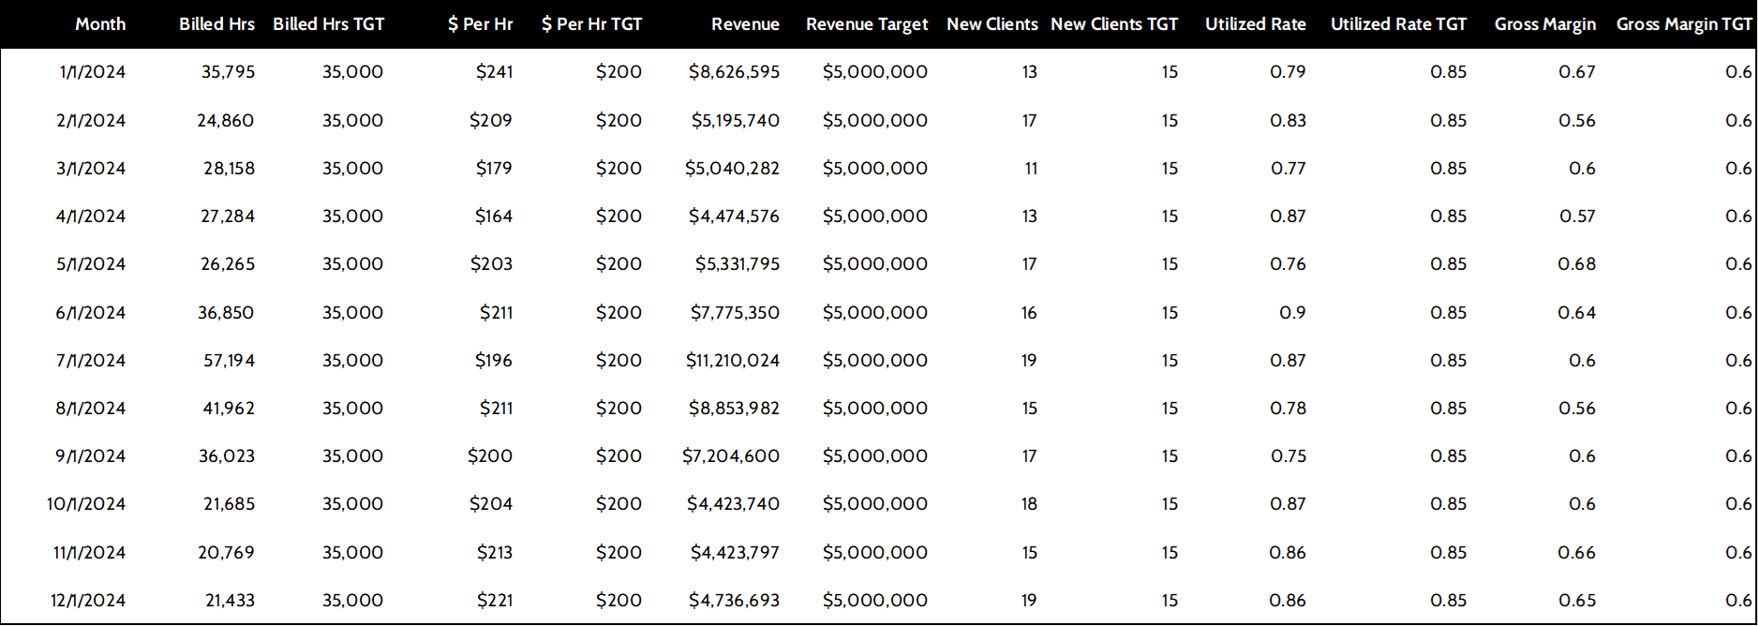
Here's a business question every leader asks: where did we fall below target last year?
Below is the answer as a table. Six metrics, twelve months, a target sitting beside each one. Give yourself three seconds to find every month revenue came in under its $5M target.
Ready? Go.
Time's up. Did you catch them all?
If you did, you worked for it. You scanned row by row, compared each number to its target, and held the misses in your head. That isn't reading a story. That's doing math under pressure.
Now Watch What a Visual Does
Same data. Same question. But this time the misses are shaped, not buried. The below-target months light up, and the answer lands before you've even finished reading the title.
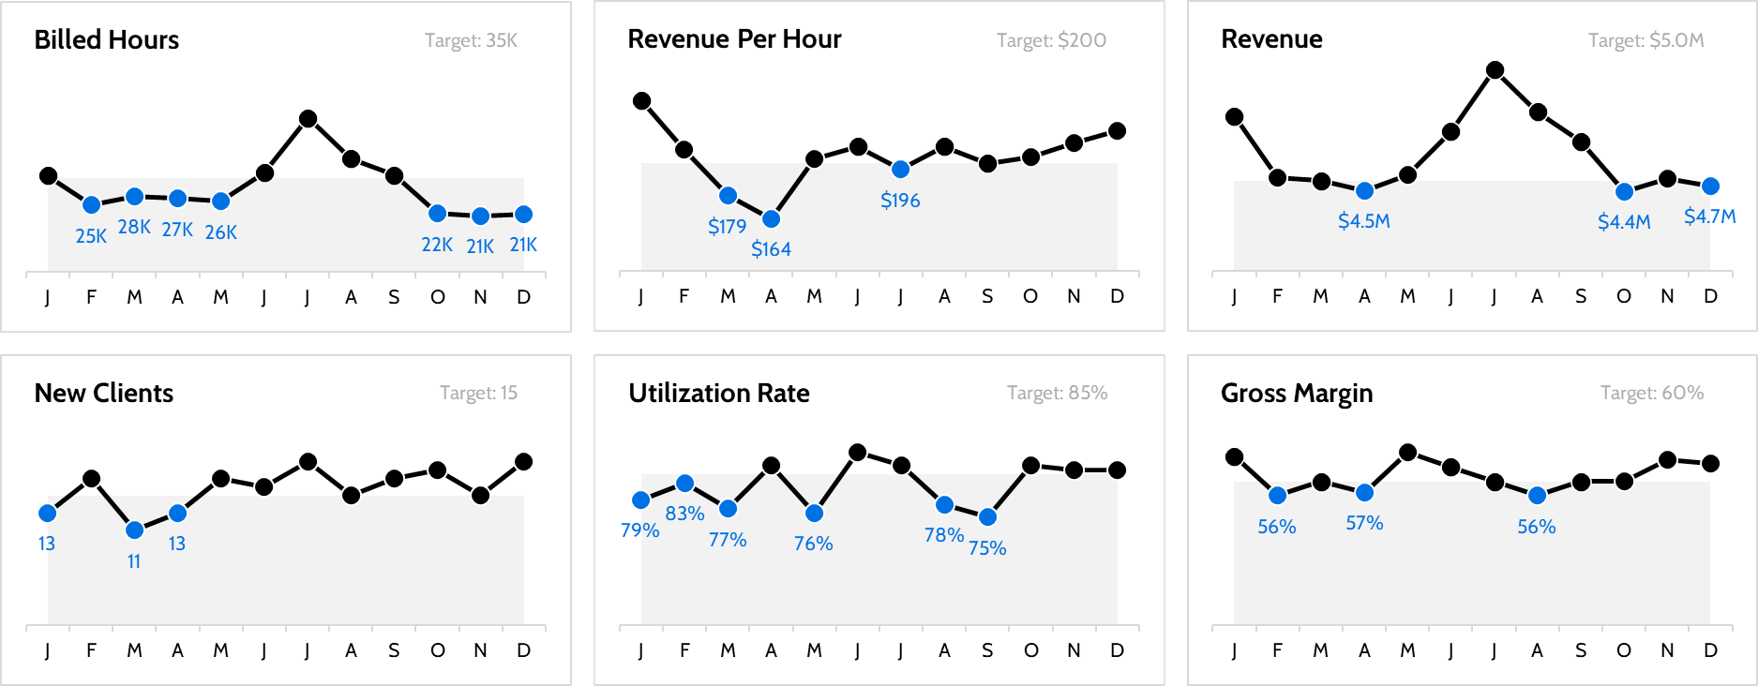
Three seconds. Revenue sagged in the spring, spiked mid-year, and faded again into the fall. You didn't calculate that. You saw it.
That gap, the hunt versus the glance, is the entire difference between a table and a story.
Design One Visual. Then Reuse It.
Here's the technique most people skip.
Don't build six different charts for six metrics. Build one simple visual that reveals the story, then reuse that exact same shape for every metric and its target. Look again at the grid above. Billed Hours, Revenue Per Hour, Revenue, New Clients, Utilization Rate, Gross Margin, all read identically. Same axis, same target band, same blue dot for a miss.
This is called common multiples. One chart, repeated across the grid, so the reader learns to read it once and then scans all six effortlessly. The pattern does the talking.
A table isn't a story. It's a lookup.
The moment you give the data a shape, the story stops hiding and starts speaking.
Take Action
Before you drop another table into your next report, ask one question:
"Could a leader find the story here in three seconds?"
If the answer is no, you don't need more data. You need a shape.
That's how you move from publishing reports to driving decisions.
Whenever you're ready, there are 3 ways we can help you and your team: