
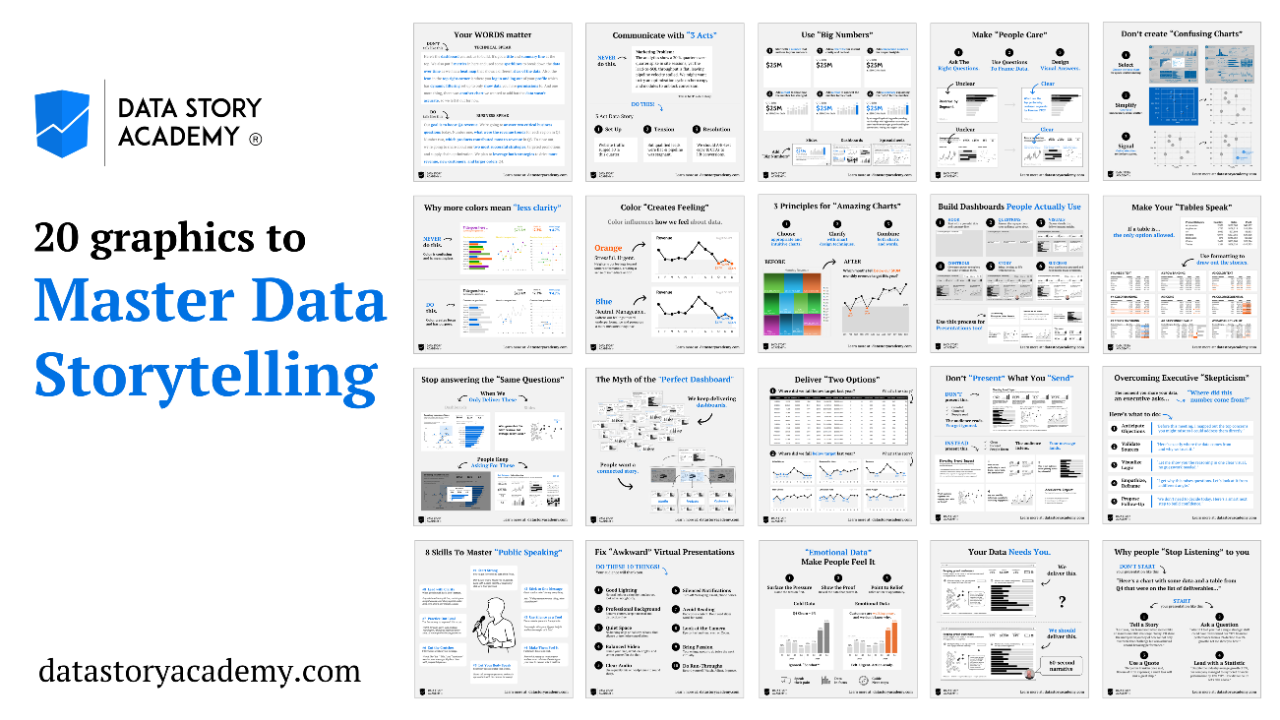
20 Graphics That Will Instantly Improve Your Data Storytelling
Clear, actionable graphics that transform how you deliver slides, dashboards, and decisions.
What you'll get: Quick lessons. Real impact.
Hook Your Audience
- Speak business language
- Communicate with 3-Acts
- Use big numbers
- Make people care
Design for Clarity
- Fix confusing charts
- Reduce color noise
- Make people feel
- Avoid chart confusion
Structure Your Story
- Design intuitive dashboards
- Make tables speak
- Answer additional questions
Guide Business Thinking
- Deliver connected stories
- Rethink stakeholder asks
Present with Confidence
- Separate speak/send decks
- Build executive trust
- Speak with confidence
- Polish virtual presentations
Add Emotion & Voice
- Create emotional data
- Add your voice
- Make people listen
Make your insights impossible to ignore.
